Planned vs Actual Progress in Construction: How to Spot a Slipping Project Early
Ask a project manager how a site is doing and you will usually get a percentage. Sixty percent. Seventy-five percent. It sounds precise, and it is almost always a feeling rather than a measurement.
This matters because that number travels. It goes into the monthly review, the client update, the board pack. Decisions get made on it. And when the project finally slips in a way nobody can ignore, everyone looks back and realises the warning signs were there for months, buried inside a number that was never accurate to begin with.
Planned versus actual progress is the discipline of replacing that feeling with a measurement. This guide covers how to do it properly, what to watch for, and how to catch slippage while it is still small enough to recover.
What Planned vs Actual Actually Means
The idea is simple. At the start of a project you produce a baseline programme that says how much work should be complete by any given date. As the project runs, you measure how much work is genuinely complete on that date. The difference between the two is your variance.
Planned tells you where you should be. Actual tells you where you are. Variance tells you how much trouble you are in and how fast it is growing.
The difficulty is never the concept. It is getting an actual number you can trust.
Three Ways Sites Measure Progress Badly
Most progress reporting fails in one of three predictable ways.
1. Progress by Gut Feel
The site engineer looks around, considers what has been happening, and says seventy percent. There is no calculation behind it.
Gut feel is not useless. An experienced engineer’s instinct is often directionally right. The problem is that it is optimistic under pressure, it cannot be audited, and it cannot be compared across sites. Two engineers looking at identical progress will report different numbers.
2. Progress by Time Elapsed
Six months into a twelve month project, so we must be around fifty percent.
This is the most dangerous method because it produces a number that is always reassuring and never true. Construction does not progress in a straight line. Early stages are slow, the middle is fast, finishing works crawl. Time elapsed tells you about the calendar, not the building.
3. Progress by Money Spent
We have spent sixty percent of the budget, so we are sixty percent complete.
This confuses cost with progress. You can spend sixty percent of a budget through advance material purchase, mobilisation and preliminaries while very little physical work has happened. Money spent is a financial fact, not a progress measurement.
How to Measure Physical Progress Properly
Real progress measurement is physical. It is based on quantities of work actually executed, weighted by how much of the total project each activity represents.
The method has three steps.
Step 1: Assign a weightage to each activity. Break the project into activities and give each one a share of the total, usually based on its value or its man-hours in the BOQ. Excavation might be 3 percent of the project. Superstructure might be 28 percent. The weightages should add to 100.
Step 2: Measure completion within each activity by quantity. If the superstructure involves 4,200 cubic metres of concrete and you have poured 1,680, that activity is 40 percent complete. This comes from quantities, not opinion.
Step 3: Multiply and add. Each activity contributes its completion percentage multiplied by its weightage. Sum them and you have overall physical progress.
| Activity | Weightage | % Complete | Contribution |
|---|---|---|---|
| Excavation | 3% | 100% | 3.00% |
| Foundation | 12% | 100% | 12.00% |
| Superstructure | 28% | 40% | 11.20% |
| Blockwork | 9% | 15% | 1.35% |
| MEP rough-in | 14% | 5% | 0.70% |
| Finishes | 22% | 0% | 0.00% |
| External works | 12% | 0% | 0.00% |
| Total | 100% | 28.25% |
That 28.25 percent is a defensible number. It came from measured quantities. Anyone can check it. And critically, when you compare it against what the baseline said should be complete on that date, the variance means something.
The S Curve, Without the Jargon
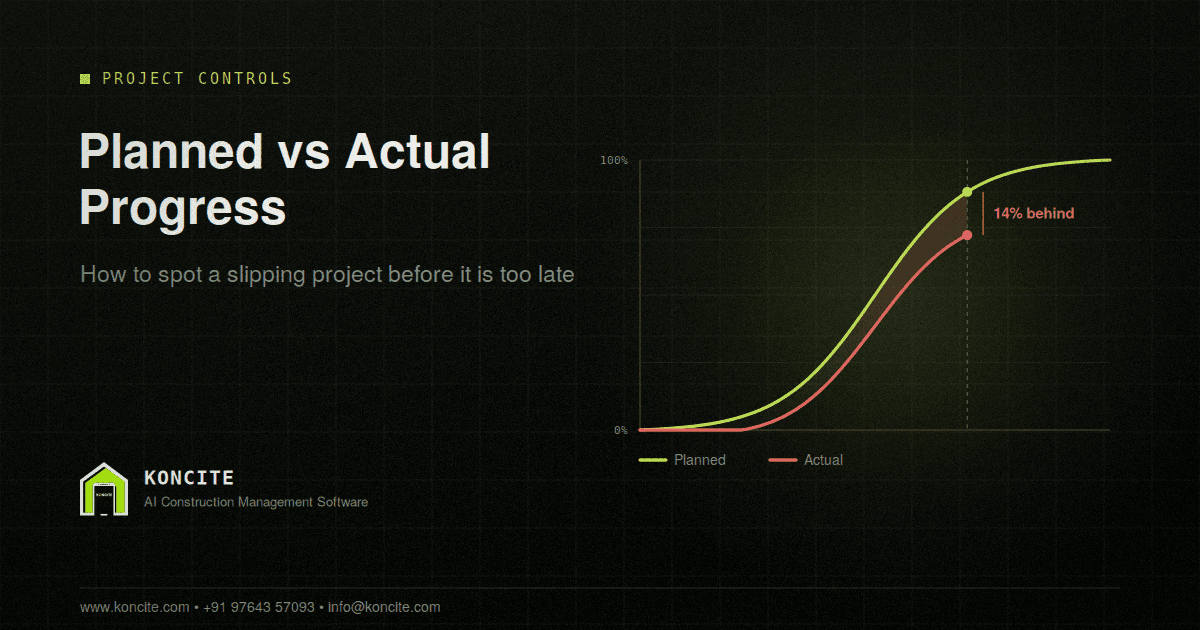
If you plot cumulative planned progress against time, you get a curve shaped roughly like a stretched S. Slow at the start during mobilisation and foundations, steep through the main structural phase, flattening out through finishing works.
Plot your actual progress on the same chart and the gap between the two lines is your schedule health, visible at a glance.
What matters is not just the gap but its direction. A gap that is stable means you fell behind once and are now keeping pace. A gap that is widening every week means the rate of work is below plan and the problem is compounding. The second situation is far more serious than the first, and looking at a single month’s percentage will never tell you which one you are in.
Early Warning Signals
By the time overall progress is visibly behind, the cause usually started weeks earlier. These are the signals that appear first.
A single activity slipping repeatedly. Overall progress can look acceptable while one critical activity falls further behind each week, masked by other activities running ahead. Watch activity level variance, not just the project total.
Rate of progress dropping. You completed 2.1 percent last week, 1.8 percent this week, 1.4 percent the week before that. Total progress is still rising, so nothing looks wrong. The rate says otherwise.
Hindrances repeating in the same category. If your daily reports keep recording delays for the same reason, awaited drawings or pending approvals or material shortage, that is a systemic problem that will keep consuming schedule until someone addresses the cause.
Planned activities not started. An activity that should have begun three weeks ago and has not started yet is a clearer signal than any percentage. It is also the easiest thing to check and the most commonly ignored.
Labour deployment below plan. If the programme assumed 120 workers on a work front and you have averaged 70 for a fortnight, the slippage is already locked in even if it has not shown up in the numbers yet.
Common Mistakes
Updating the baseline to match reality. When a project falls behind, there is pressure to revise the programme so the variance disappears. Sometimes a re-baseline is legitimate. Often it is just hiding the problem, and it destroys your ability to see how far you have drifted.
Measuring monthly. A month is too long. By the time a monthly report reveals a problem, four weeks of work have been done at the wrong rate. Weekly measurement is the minimum for any active project.
Averaging across sites. A portfolio figure of 68 percent across eight sites can hide one site at 30 percent. Roll up for reporting, but always keep the site level view for decisions.
Treating variance as a performance review. If reporting slippage gets people criticised, they will report less slippage. The number will improve and the project will not. Variance is a management tool, not a disciplinary one.
Why This Is Hard Without the Right System
Everything described above is standard project controls practice. Most construction companies know it. The reason it does not happen consistently is effort.
To calculate physical progress weekly you need current quantities for every activity across every site, collected reliably, then weighted and compared against the baseline. Done manually that means chasing site engineers, collecting spreadsheets, rebuilding calculations, and producing a chart. It takes a planning engineer a significant part of their week, and on smaller projects there is no planning engineer at all.
This is where AI construction management software changes what is practical. When daily progress is logged at site with proper quantities as work happens, the physical progress calculation has everything it needs already. Planned versus actual updates itself, activity level variance surfaces on its own, and delayed activities appear as alerts rather than as a discovery made during a monthly review.
Koncite AI is built this way. Site teams record what they completed with quantities from a phone, and management sees live progress across every project on one dashboard, with delayed activities flagged automatically. The calculation is not the hard part. Getting reliable field data without adding work for the site team is, and that is the part worth solving.
Frequently Asked Questions
What is planned vs actual progress in construction? It is the comparison between how much work your baseline programme said should be complete on a given date and how much is genuinely complete. The difference is the schedule variance.
How do you calculate actual physical progress on a construction project? Assign each activity a weightage based on its share of project value or man-hours, measure completion within each activity using executed quantities, then multiply each activity’s completion by its weightage and add them together.
How often should planned vs actual progress be reviewed? Weekly for any active project. Monthly review means a problem is already four weeks old before anyone sees it.
What is an S curve in construction? It is a chart of cumulative progress plotted against time. It takes an S shape because work is slow during early stages, fast through the main structural phase, and slow again through finishing works. Plotting actual progress against the planned curve shows schedule health visually.
What is an acceptable variance between planned and actual progress? There is no universal figure, and it depends on project type and stage. What matters more than the size of the gap is whether it is stable or widening. A small gap growing every week is a more serious signal than a larger gap that has held steady.
In Short
A progress percentage is only useful if somebody can explain how it was calculated. If the answer is that the site engineer estimated it, you do not have a progress report. You have an opinion with a decimal point.
Weight your activities, measure by quantity, compare weekly against the baseline, and watch the direction of the gap rather than just its size. Projects rarely fail suddenly. They fail slowly, in a way that was visible for months to anyone measuring properly.